- App Store
- ASO
- Ranking
App Store top charts: how chart rankings work and how to track your app's rank for free
How App Store top charts and Google Play charts rank apps, why category and timing matter, and a free script that tracks your chart position every day.
AppRanker team11 min read
On this page
The App Store top charts are the oldest discovery surface on the store, and still the most misunderstood. Developers ask how many downloads it takes to reach the Top Free chart, why their app jumped forty places overnight and fell back the next day, and whether the ranking counts ratings, revenue or retention. Apple has never published the formula, so most answers online are guesses stated as facts.
This guide sticks to what can be checked. It covers what Apple and Google have actually said about how their charts work, what developers consistently observe, how to choose a category you can realistically chart in, and a short script that reads Apple's public chart feeds so you can track your own App Store top charts position every day without paying for a tool.
What the App Store top charts are
Every chart answers one narrow question: which apps are doing best right now, in one country, on one kind of device, in one list. There is no single "App Store rank". An app can be #3 in Utilities in Germany and absent from the overall Top Free chart in the US at the same moment.
The lists you will meet most often:
- Top Free and Top Paid, for all apps and for each category, which people browse in the App Store app.
- Top Grossing, ranked by revenue, which Apple also publishes in its chart feeds.
- Separate charts for iPhone and iPad.
Google Play has its own Top charts, also split into free, paid and grossing lists and by category, with separate charts for apps and games.
Which category you chart in
On the App Store, you chart in your primary category. Apple's category guidance says the primary category "will be the category in which the app appears when people browse the App Store or filter search results, and it determines placement on the Apps tab or Games tab". The secondary category does not put you in a second chart.
This makes the primary category one of the few chart decisions you control. A habit tracker can choose Productivity or Health & Fitness, and the two charts can need very different download numbers to crack the top 50. Apple also warns that choosing a category that does not reflect your app's core experience is against the App Review Guidelines, so pick the most competitive-for-you option among the honest ones, not the emptiest category on the store.
How chart rankings are calculated
Neither store publishes its chart formula. Here is what each has said, and what developers observe.
What Apple has said
Apple's public statements are about what is not allowed. App Review Guideline 5.6.3, Discovery Fraud, reads: "Manipulating any element of the App Store customer experience such as charts, search, reviews, or referrals to your app erodes customer trust and is not permitted." The introduction to section 3 goes further: if Apple finds you have tried to "inflate your chart rankings with paid, incentivized, filtered, or fake feedback, or engage with third-party services to do so on your behalf", it may expel you from the Apple Developer Program (App Review Guidelines).
What Google has said
Google has been more open about its charts. In 2017 it told TechCrunch that it had changed how games are ranked in Play's Top Charts and genre lists, promoting "titles with stickiness (strong engagement and retention metrics)" alongside traditional measures such as star rating, rather than counting downloads alone. Google's User Ratings, Reviews, and Installs policy forbids attempts to "manipulate the placement of any apps on Google Play", including inflating install counts "by illegitimate means".
What developers consistently observe
Across years of developer reports, ASO tool vendors and Hacker News threads, a few patterns are consistent:
- Recent downloads matter far more than lifetime downloads. A burst of installs over a few days moves an app more than a large but steady base. That is why charts are dominated by launches, viral moments and big campaigns.
- Charts move within a day. Positions can change between morning and evening, and Apple's feeds carry an
updatedtimestamp so you can see when each snapshot was taken. - Each chart has its own bar. The installs needed for #10 in a small category in a small country can be a tiny fraction of what the overall US chart needs.
- Google Play leans further toward quality signals, as its 2017 statement suggests, so a spike of installs that churn quickly carries less weight there.
Treat any precise number you read ("you need 4,000 downloads a day for the top 100") with suspicion unless it comes with the country, the category, the date and the source. Those numbers change with the season and the competition.
Are the top charts still worth chasing?
Less than they used to be, and more than nothing.
Search is where most App Store downloads begin, and Apple's own analytics reflect that split. App Store Connect separates App Store search from App Store browse, which Apple defines as people who "viewed your app or tapped to download it while browsing the App Store (for example, in the Today, Games, or Apps sections)" (Apple's definitions). Charts live in that browse traffic, alongside editorial stories and collections.
The bigger effect of a good chart position is indirect. A spike that puts you in the charts also tends to lift search visibility for a few days, brings in reviews, and gives you a screenshot that press and communities take seriously. One developer on Hacker News who had seen apps "ranked anywhere from #1 to #5000" was blunt about the limits: "the organic download boost from being in the Top 50 is minuscule. It's not self sustaining." The chart reflects momentum; it rarely creates it on its own.
Google Play has nudged its charts in the other direction recently. Play Store v52.7, released on August 10, 2026, made it possible to "open app details pages from the Top Charts page on large screens" (Google system release notes), one fewer tap between a chart and your listing on tablets and foldables.
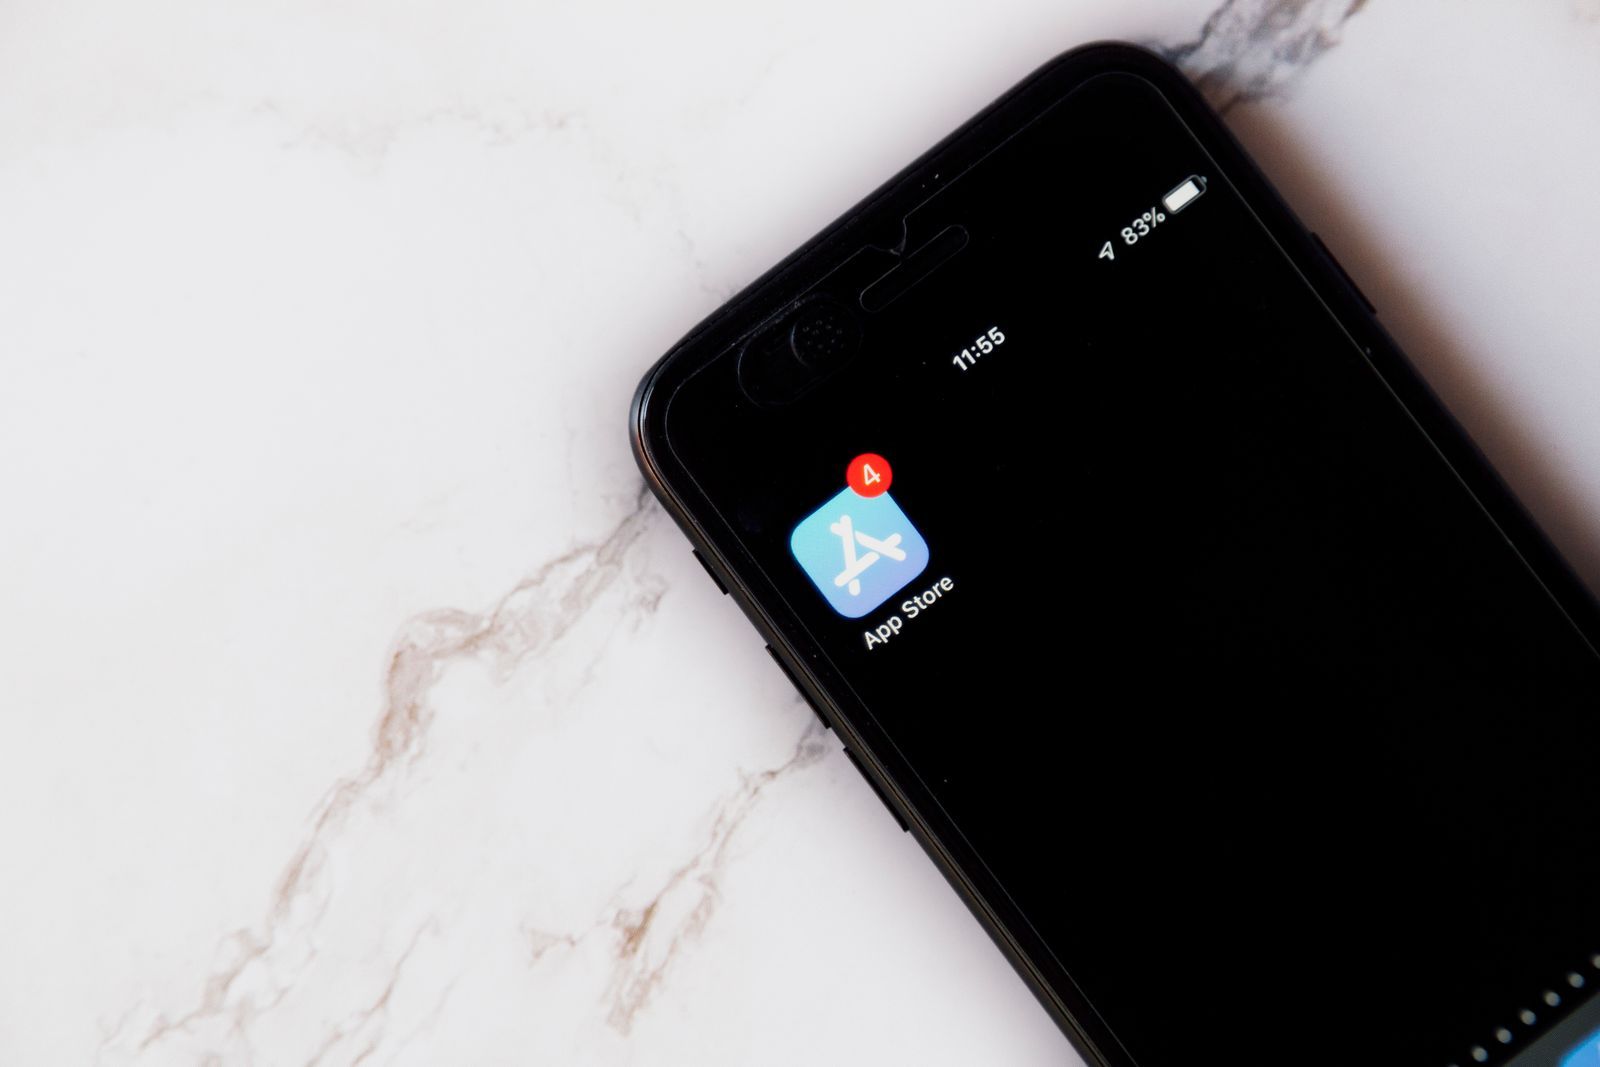
A chart position is a snapshot of one list, in one country, at one hour. Photo: Image Hunter / Pexels
How to track your App Store chart position for free
Apple publishes its top charts as public JSON feeds, built for marketing use. There are two:
- The current RSS Builder at rss.marketingtools.apple.com, with URLs such as
https://rss.marketingtools.apple.com/api/v2/us/apps/top-free/100/apps.json. It covers Top Free and Top Paid by country, up to 100 apps, but not categories. - The older iTunes feed at
https://itunes.apple.com/<country>/rss/<chart>/limit=100/genre=<id>/json, which still answers and accepts a genre parameter for category charts. Chart names includetopfreeapplications,toppaidapplications,topgrossingapplicationsand the iPad variants such astopfreeipadapplications. In our tests in October 2026 it returned at most 100 entries per chart.
The legacy feed is undocumented, so treat it as a convenience that could change, not an API with a contract. With that caveat, it is enough to answer "where is my app today?" in a few lines of Node.js 18 or later:
// chart-rank.mjs: where does an app sit in Apple's public top charts?
// Usage: node chart-rank.mjs <appId> [genreId]
const appId = process.argv[2];
const genre = process.argv[3]; // e.g. 6007 for Productivity; omit for all apps
const countries = ['us', 'gb', 'de', 'jp', 'br'];
const charts = ['topfreeapplications', 'toppaidapplications'];

for (const country of countries) {
  for (const chart of charts) {
    const url =
      `https://itunes.apple.com/${country}/rss/${chart}/limit=100` +
      (genre ? `/genre=${genre}` : '') + '/json';
    const res = await fetch(url);
    if (!res.ok) {
      console.log(`${country} ${chart}: HTTP ${res.status}`);
      continue;
    }
    const entries = (await res.json()).feed.entry ?? [];
    const index = entries.findIndex((e) => e.id.attributes['im:id'] === appId);
    console.log(`${country} ${chart}: ${index === -1 ? 'not in top 100' : `#${index + 1}`}`);
  }
}
Your app ID is the number after id in your App Store URL, for example 1234567890 in apps.apple.com/us/app/your-app/id1234567890. Run it with your primary category's genre ID:
node chart-rank.mjs 1234567890 6007
The output is one line per country and chart:
us topfreeapplications: #37
us toppaidapplications: not in top 100
gb topfreeapplications: #12
...
A few common genre IDs: 6000 Business, 6002 Utilities, 6007 Productivity, 6013 Health & Fitness, 6014 Games, 6017 Education. Each category page on the App Store shows its ID in the URL, such as apps.apple.com/us/genre/ios-utilities/id6002.
To build a history, run the script once a day from a scheduler you already have, and append the output to a file with the date. Two weeks of data tells you more than any single snapshot: whether a launch spike held, whether an update moved you, and which countries are worth a localized listing.
Google Play has no public chart feed
Google does not publish Play's charts as a feed or an API, and Play Console does not show your chart position. For Play, check the Top charts tab in the Play Store app for your category and country, or use a third-party ASO tool. Scraping Play's pages at scale is fragile, can conflict with Google's terms, and the store is personalised enough that the results may mislead you anyway.
How to climb the charts without breaking the rules
Since recent downloads drive the charts, the honest way up is to concentrate real installs into a short window:
- Choose the primary category deliberately. Look at the current top 100 in each honest option with the script above, and pick the one where your expected launch numbers land you in view.
- Line up demand before launch day. App Store pre-orders and Google Play pre-registration turn weeks of promotion into installs on a single day. Our guide to Google Play pre-registration covers the setup and the 90-day limit, including how iOS pre-orders compare.
- Ask Apple's editors. A featuring nomination is free, and a feature on the Today tab is one of the biggest download spikes an indie app can get. See how to get featured on the App Store.
- Concentrate your launch. Send your newsletter, community posts, press and paid campaigns in the same 48 hours instead of spreading them over a month. Our launch-week visibility checklist helps you line them up.
- Make the listing convert. A spike of visitors only becomes a spike of installs if the product page works. Start with writing a store listing that converts and the keyword rules in App Store search in 2026.
- Keep the users you get. On Google Play especially, retention and engagement feed the ranking, so a spike of installs that uninstall within a day is worth less than a smaller, stickier one.

Log your position daily and note what you did that day: a launch, an update, a newsletter. Photo: AlphaTradeZone / Pexels
What not to do
Incentivized installs, install farms, "chart boosting" services and review exchanges that trade installs all fall under Apple's Discovery Fraud rule and Google's installs policy. The penalty on the App Store can be removal from the developer program, not just the chart. A paid campaign that brings real users, from Apple Ads or any other channel, is fine; paying people to install is not.
Your App Store top charts checklist
- Primary category chosen on purpose, after checking each honest option's current top 100.
- App ID and genre ID noted, and the chart script running once a day.
- A daily log of chart position next to what you shipped or promoted.
- Launch demand lined up: pre-orders on iOS, pre-registration on Google Play.
- A featuring nomination submitted at least three weeks before the launch or update.
- Launch promotion concentrated into one or two days.
- Product page ready to convert the spike.
- No incentivized installs, install farms or chart-boosting services.
A chart where the rule is printed on the page
Store charts are useful, but they are a black box: you can measure where you are, not why. AppRanker takes the opposite approach for browser extensions and mobile apps. Its leaderboard is a pay-to-rank list where the whole rule fits in one sentence: rank is a plain descending sort on what each listing has paid, with no algorithm in between, and every row links straight to your App Store or Google Play page. Our post on getting discovered with a leaderboard listing explains what a position does and does not buy.
If you want a chart position you can see and plan around, paste your app's store link on the AppRanker home page and every rank shows its price before you pay.
FAQ
How are the App Store top charts calculated?
Apple does not publish the formula. Developers consistently observe that recent download volume, over the last few days rather than all time, is the main driver, with each chart calculated separately per country, category and device. Apple's guidelines forbid manipulating charts with paid, incentivized or fake activity.
How many downloads do I need to reach the App Store top charts?
There is no fixed number. It depends on the country, the category, the chart (free or paid), the device and the season. A small category in a small country can need a tiny fraction of the daily installs the overall US Top Free chart needs. Track the current chart for your category to see where you stand.
Does the secondary category put my app in a second chart?
No. On the App Store, the primary category determines where your app appears when people browse and which category chart it is ranked in.
Can I check my app's chart rank for free?
Yes, for the App Store. Apple publishes public chart feeds: the RSS Builder at rss.marketingtools.apple.com for overall Top Free and Top Paid charts, and an older iTunes feed that also accepts a category genre ID. A short script can find your app ID in them every day. Google Play has no public chart feed.
Do Google Play top charts work the same way?
Not exactly. Google has said it considers engagement and retention, not just downloads, when ranking games in its Top Charts. Play charts are also split by country and category, and Google's policy forbids inflating installs by illegitimate means.
Image credits
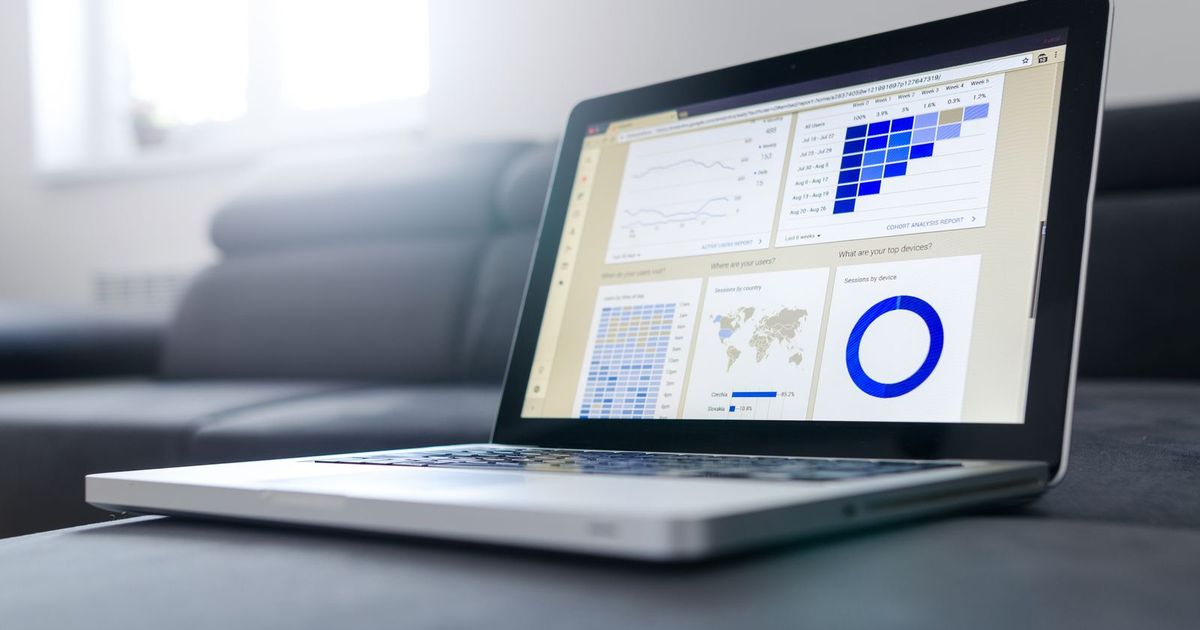
- Cover, laptop with an analytics dashboard: photo by Lukas Blazek on Pexels, Pexels License. Cropped to 1200x630.
- iPhone with an App Store badge: photo by Image Hunter on Pexels, Pexels License. Resized.
- Charting results beside a laptop: photo by AlphaTradeZone on Pexels, Pexels License. Resized.