- ASO
- App Store
- Google Play
App Store A/B testing: run product page optimization and Google Play store listing experiments
App Store A/B testing for small apps: set up product page optimization and Play store listing experiments, size the test and read the results correctly.
AppRanker team12 min read
On this page
App Store A/B testing is free on both stores, and most small apps never use it. Apple's product page optimization and Google Play's store listing experiments let you show a different icon or set of screenshots to a share of real store visitors and measure which version gets more installs. The catch, and the reason many indie developers give up, is traffic: a test on a page with a few hundred visitors a day can run for months and end "inconclusive."
This guide covers what each store lets you test, how to estimate whether your app has enough traffic before you start, the exact setup steps in App Store Connect and Play Console, and how to read the results without fooling yourself.
Key takeaways
- Apple's product page optimization tests up to three treatments of your icon, screenshots and app previews for up to 90 days, one test at a time.
- Google Play's store listing experiments test up to two variants of your icon, feature graphic and screenshots, and, in localized experiments, your descriptions.
- Neither store lets you A/B test your app name. Apple does not test the subtitle or keyword field either.
- Estimate the traffic you need first. A small app should test big, visible changes, starting with the first screenshot, not small tweaks.
- Wait for the store's verdict: Apple's 90% confidence label, or Play's recommendation. Stopping early on a good-looking day is the most common mistake.
What App Store A/B testing can and cannot test
| Apple product page optimization | Google Play store listing experiments | |
|---|---|---|
| What you can test | App icon, screenshots, app previews | Icon, feature graphic, screenshots; descriptions in localized experiments |
| Variants per test | Up to 3 treatments plus the original | Up to 2 variants plus the current listing |
| Tests at once | One | One default graphics experiment, or up to five localized experiments |
| Maximum length | 90 days | Stops automatically after 6 months |
| Who sees it | Visitors on iOS and iPadOS 15 or later | Visitors to the listing, in the languages you choose |
| Review | New metadata must be approved by App Review | Submitted with your other listing changes |
| Result | Conversion rate, lift and confidence in App Analytics | Recommendation, "Draw" or "More data needed" |
Sources: Apple's product page optimization overview and Google's store listing experiments help.
A few limits worth knowing before you plan:
- Apple only tests your default product page. Tests are not available for custom product pages, or for the Apple Watch and iMessage App Stores.
- Alternate icons must already be in your app. Apple says any icon you test "must be part of the app binary for the current App Store version," built with Xcode 13 or later with alternate icons in the asset catalog, at 1024x1024 pixels. Plan icon tests one release ahead.
- A test cannot be edited once it starts, and a stopped test cannot be restarted. You create a new test instead.
- Play's localized experiments are the only store-native way to test text. That makes them useful for checking a new description before you rewrite it in every language.
Apple's June 2026 update added Creative Assets, images and videos for the product page header and search results, which Apple says "work with custom product pages and product page optimization." If you adopt them, they are a natural first test. We covered them in App Store search in 2026.
Before you start: does your app have enough traffic?
A test needs enough visitors in every arm to tell a real difference from noise. How many depends on your current conversion rate and the size of the difference you hope to find. Both stores estimate this for you during setup, using your own impressions and downloads, and that estimate is the one to trust. It is still worth running the numbers yourself before you design anything, because it tells you what kind of change is worth testing at all.
This Python script uses a standard two-proportion approximation (90% confidence, 80% power). It is a rough guide, not the store's own Bayesian model:
import math
from statistics import NormalDist


def impressions_per_arm(baseline_cr, relative_lift, confidence=0.90, power=0.80):
    """Rough visitors needed in EACH arm to detect a relative lift."""
    p1 = baseline_cr
    p2 = baseline_cr * (1 + relative_lift)
    z_alpha = NormalDist().inv_cdf(1 - (1 - confidence) / 2)
    z_beta = NormalDist().inv_cdf(power)
    p_bar = (p1 + p2) / 2
    numerator = (
        z_alpha * math.sqrt(2 * p_bar * (1 - p_bar))
        + z_beta * math.sqrt(p1 * (1 - p1) + p2 * (1 - p2))
    ) ** 2
    return math.ceil(numerator / (p2 - p1) ** 2)


def days_to_finish(daily_impressions, baseline_cr, relative_lift, variants=1, traffic_share=0.5):
    n = impressions_per_arm(baseline_cr, relative_lift)
    per_variant = daily_impressions * traffic_share / variants
    original = daily_impressions * (1 - traffic_share)
    return n, math.ceil(n / min(per_variant, original))


for daily in (300, 1000, 5000):
    for lift in (0.10, 0.20, 0.30):
        n, days = days_to_finish(daily, baseline_cr=0.05, relative_lift=lift)
        print(f"{daily:>5}/day, +{lift:.0%}: {n:>6} per arm, ~{days} days")
For an app converting 5% of its impressions, one treatment, and half the traffic in the test, it prints:
  300/day, +10%:  24603 per arm, ~165 days
  300/day, +20%:   6426 per arm, ~43 days
  300/day, +30%:   2978 per arm, ~20 days
 1000/day, +10%:  24603 per arm, ~50 days
 1000/day, +20%:   6426 per arm, ~13 days
 1000/day, +30%:   2978 per arm, ~6 days
 5000/day, +10%:  24603 per arm, ~10 days
 5000/day, +20%:   6426 per arm, ~3 days
 5000/day, +30%:   2978 per arm, ~2 days
What this means in practice:
- At a few hundred impressions a day, only big effects are findable inside Apple's 90 days. Test a bold change, such as a new first screenshot with a different message, not a slightly different shade of blue.
- Every extra treatment divides the traffic. With low traffic, test one treatment against the original.
- Put more traffic in the test. A 50% or higher traffic share finishes faster. The risk is that a worse treatment costs you installs while it runs, which is why a big bet deserves a smaller share and a safe tweak a larger one.
Your real numbers are in App Store Connect Analytics (impressions and conversion rate) and in Play Console's store listing acquisition reports. If you have never looked at where your visitors come from, our guide to free ASO keyword research shows where both stores report search traffic.
Choose what to test first
Write the hypothesis down before you build the treatment. Photo: Maryana (WMF), Wikimedia Commons, CC BY-SA 4.0
Every test should start from a written hypothesis: "Leading with the outcome ('Fall asleep in 10 minutes') instead of the feature list in the first screenshot will raise conversion, because new visitors don't know what the app does." It forces one change per test and tells you what to do with the answer.
Ideas that are big enough for a small app to measure, in rough order of impact:
- The first screenshot or two. They show in search results and in the top of the product page, and they carry the message for most visitors. Test the message, not the decoration.
- Screenshot order. Moving your strongest feature to the front costs nothing to make. On Apple, reordering screenshots already on the App Store needs no new review.
- The app preview video. Apple's own case study on its product page optimization page describes a developer who expected a video to win and found the original page without the video performed better. Test it rather than assume it.
- The icon. A different color or symbol can change conversion, and on Apple the treatment icon follows the user to their home screen if they download, so test only icons you are happy to ship.
- On Play, the short or full description, through a localized experiment in your main language.
Our guide to writing a store listing that converts covers what makes a strong first screenshot and icon in the first place.
How to set up product page optimization in App Store Connect
Your app must be live with a Ready for Distribution status, and you need the Account Holder, Admin, App Manager or Marketing role. Apple's help page on creating a test gives these steps:
- In App Store Connect, open your app and click Product Page Optimization in the sidebar, then Create Test (or the add button next to Product Page Optimization if you have run one before).
- Enter a reference name you will recognize in App Analytics, such as "First screenshot: outcome vs features".
- Choose the number of treatments, up to three.
- Choose a traffic proportion. Apple's example: with three treatments and 30% of traffic, each treatment is shown to 10% of visitors.
- Select the localizations to include. Visitors who see an excluded localization are not part of the test.
- Open Estimate Your Test Duration, choose the improvement you hope for, and read the estimated duration and impressions needed. If it is longer than 90 days, reduce the treatments or raise the traffic share.
- Click Create Test, then configure each treatment: rename it, pick an alternate icon from the ones in your binary, and add screenshots and previews per device size. Anything you leave alone uses your original page.
- Click Start Test. If the new screenshots or previews need review, add the test to a submission. Apple says these can be submitted without a new app version, and items in the submission are reviewed together with your latest iOS version.
Results appear in Analytics, under Acquisition, then Product Pages, once the test has five first-time downloads. Apple's results guide says Analytics uses "Bayesian techniques designed specifically for App Store product page data," and labels a treatment Performing Better or Performing Worse once it reaches 90% confidence. A test that is unlikely to reach significance may be marked Likely to be Inconclusive.
One caution from Apple's overview: "Releasing a new app version while a test is in progress may impact the results if your version contains assets or metadata that are currently being tested." Plan releases around the test, or keep the tested assets unchanged in the release.
How to run a Google Play store listing experiment
Google's store listing experiments work on your main listing and on custom store listings. The listing must be fully rolled out first.
- In Play Console, go to Grow users, then Store presence, then Store listings.
- In the Experiment column for the listing, click Set up.
- Name the experiment (50 characters or fewer; users never see it).
- Choose Graphics experiment on default listing or Experiment on a localized listing, and for a localized one, select up to five languages.
- Choose the target metric: unique user install clicks, open clicks or pre-registration clicks. For most apps, install clicks is the right one.
- Leave the advanced settings at their defaults unless you have a reason. Google says the defaults "give you results in the shortest time with reasonable accuracy." They control the number of variants (up to two), the audience percentage, the minimum detectable effect and the confidence level.
- Pick the asset type to test (Google recommends one asset at a time), upload the variants, save, and send the changes for review from the publishing overview.
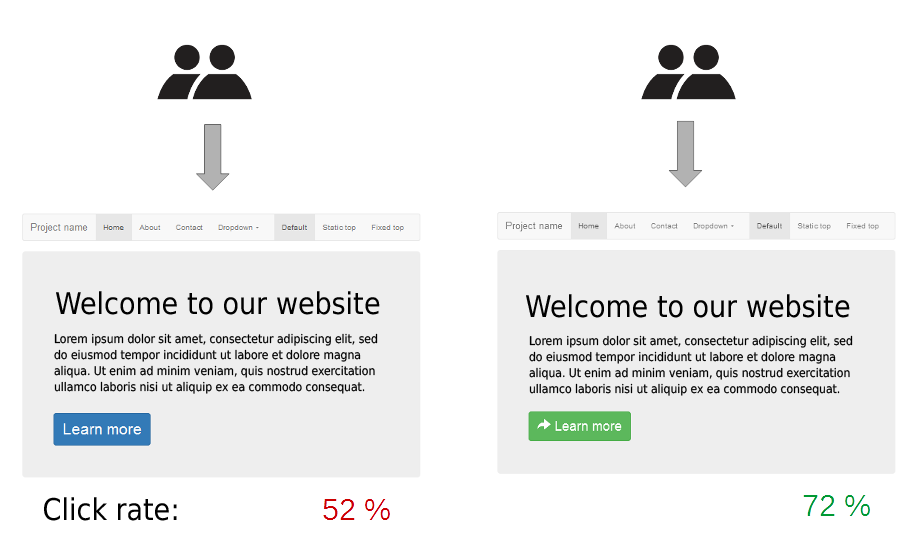
Each visitor sees one version, and the test compares the rate at which each version converts. Image: Maxime Lorant, Wikimedia Commons, CC BY-SA 4.0
Play Console estimates the time and the number of installs needed when you create the experiment. Results show which variant performs best, with an explanation based on its confidence interval and minimum detectable effect. You may see More data needed, a recommendation to apply a variant, or a Draw when the difference is smaller than your minimum detectable effect. If your current listing won, click Keep current listing.
Two Play-specific details:
- Default graphics experiments skip localized assets. If your default language is English and you have a French feature graphic, French visitors are excluded from the experiment, even when you are only testing the icon.
- Experiments stop after six months and traffic returns to the current listing, so do not leave one running and forget it.
How to read the results without fooling yourself
The store does the statistics. Your job is to not undermine them.
- Do not stop early. A treatment that leads after three days often regresses. Apple recommends waiting until a treatment is declared better or worse "with at least 90% confidence." On Play, wait for the recommendation.
- Cover full weeks. Weekday and weekend visitors behave differently. Run tests in whole weeks.
- Keep everything else stable. A big ad campaign, a feature on the store or a launch on social media changes who visits your page mid-test. If one happens, treat the result with caution or re-run it.
- Check that the winner holds up. On Apple, the treatment's icon is the one users see after download. After you apply a winner, watch retention and reviews for a few weeks, and on Play, compare open clicks as well as installs.
- Inconclusive is an answer. It means the change did not matter much. Ship whichever version you prefer for other reasons and test something bolder next.
When you have a winner, apply it. On Apple, applying a treatment while the test runs ends the test, and if the treatment uses an alternate icon, make sure that icon is included when you submit your next version. On Play, apply the recommended variant from the experiment's results.
A simple testing calendar for a small app
For an app with a few hundred to a few thousand store visitors a day:
- Month 1: First screenshot message, one treatment against the original, 50% of traffic.
- Month 2: Screenshot order, or the preview video against no video.
- Month 3: Icon, if your next release can include the alternate icons.
- Ongoing, on Play: One localized description experiment in your main language before any big rewrite.
Write down each hypothesis, the dates, the traffic share and the result in a shared document. After a few tests, that log is the most useful ASO document you have.
More installs to test with
A test needs visitors, and a store page with little traffic tests slowly. More visitors to your page, from inside or outside the store, means a test reaches a verdict sooner. Our playbook on how to promote your app for free covers the channels that bring them. Our launch-week visibility checklist covers outside sources worth lining up, and on AppRanker you can put your App Store or Google Play listing on a public leaderboard where every row links straight to the store page. It ranks by what each listing has paid, with no algorithm in between.
FAQ
Can you A/B test the App Store app name or subtitle?
No. Apple's product page optimization tests only the app icon, screenshots and app previews. Changing the name, subtitle or keywords requires a new app version, and you compare before and after in App Analytics instead.
How long should an App Store A/B test run?
Until a treatment reaches 90% confidence or the 90-day limit, and for at least one full week. App Store Connect estimates the duration from your daily impressions when you create the test; if the estimate is over 90 days, use fewer treatments or more traffic.
Does product page optimization affect App Store search ranking?
Apple does not say that a test changes ranking. Treatment screenshots and icons can appear in search results, as Apple notes, so a treatment that converts better in search can bring more downloads, and downloads are one of the user behavior signals Apple lists for search.
How many variants can I test on Google Play?
Up to two variants against your current listing, per Google's help page. You can run one default graphics experiment, or up to five localized experiments at the same time.
Is App Store A/B testing worth it for a small app?
Yes, if you test big changes. With a few hundred impressions a day, a 10% improvement can take longer than Apple's 90 days to detect, but a new first screenshot that changes conversion by 25% or more can show up within a few weeks.
Image credits
- Cover, two phones side by side: photo by cogdogblog, via Wikimedia Commons, CC BY 2.0. Cropped to 1200x630.
- Whiteboard sketch of app reader behavior: photo by Maryana (WMF), via Wikimedia Commons, CC BY-SA 4.0. Resized.
- A/B testing diagram: A-B testing example by Maxime Lorant, via Wikimedia Commons, CC BY-SA 4.0.